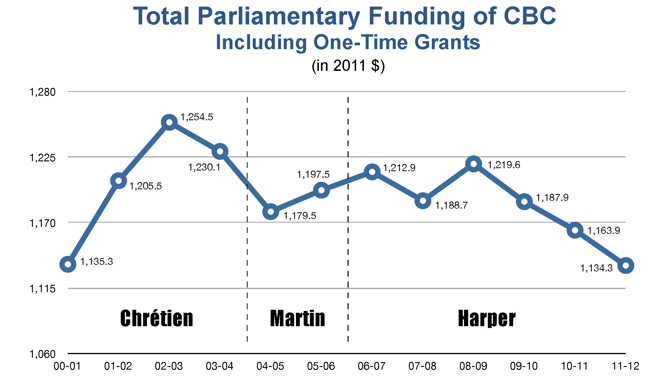
Last April, Friends of Canadian Broadcasting, a well-funded pro-CBC lobbying group, published the following graph of government funding for the CBC:

The graph has come up again because CBC’s licence is being renewed (CRTC consultation). Nonetheless, Friends’ depiction is deceptive.
-
The scale chosen makes tiny differences in value – never more than 5.2% above average or 4.79% below it, i.e., a difference of ten percentage points at the most – seem huge.
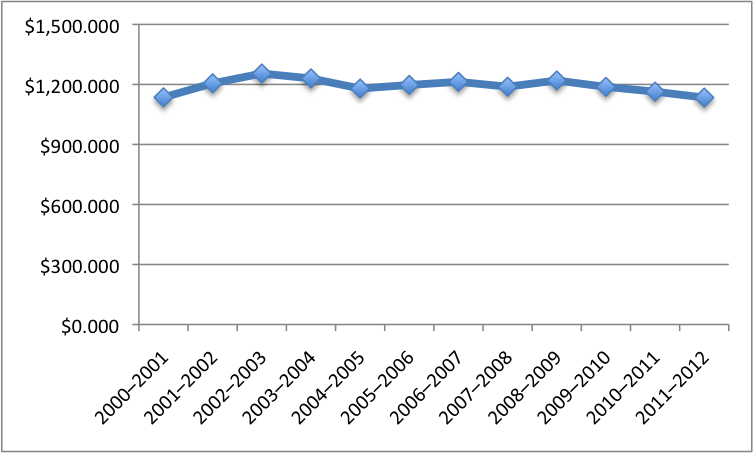
Let’s look at the values on a large scale (from $1.000 to $1.500 billion), putting in the same effort Friends did to make the type reasonable:

The trend doesn’t look so dire there, does it?
-
CBC funding has remained in the vicinity of $1.192 billion (the average value) for the entire time depicted on the graph.
-
Funding has gone up five times and down six times. Eight of twelve years show funding values clustering around the average.
-
The last three years on the graph (which include funding not actually finalized) are clearly intended to make the sitting government look like it is taking a hatchet to CBC’s funding. It is indeed reducing funding, but the endpoint shown there ($1.1343 billion) is almost equivalent to the startpoint under a previous government from the other party ($1.1353 billion).
-
The difference between minimum and maximum values is $120,200,000. That is a lot of money. You can run a dozen specialty channels on that kind of funding. But it’s a difference of about 10% of both the maximum and the minimum funding.
-
The true volatility of government funding to the CBC is ≈±10%. But the chart does not show variation in funding from other sources, including advertising, subscriber fees, program licensing, funding and production bodies, tax credits, and everything else. Nor does the chart show expenditures.
When asked for comment on all these concerns, Friends’ media contacts said nothing.